1. Introduction
Trace elements, though present in extremely small quantities in the human body, exert profound biological effects. They participate in the metabolic processes of enzymes, hormones, vitamins, and nucleic acids. Their physiological functions include assisting in the transport of macronutrients, serving as essential components or activators of enzymes, playing unique roles in hormones and vitamins, and influencing nucleic acid metabolism. In clinical medicine, analyzing the concentrations of trace elements in blood can help evaluate an individual’s health status, diagnose acute or chronic intoxication caused by certain elements, and support the formulation of subsequent treatment strategies.
Inductively coupled plasma mass spectrometry (ICP-MS) offers high sensitivity, low detection limits, a wide dynamic linear range, high analytical efficiency, multi-element simultaneous quantification, simple spectral characteristics, and minimal interference. These advantages are particularly prominent in clinical inorganic elemental analysis. Several national standards already exist for the ICP-MS determination of individual elements in blood, such as Determination of Lead in Blood — Part 2: ICP-MS (GBZ/T 316.2-2018) and Determination of Cadmium in Blood — Part 2: ICP-MS (GBZ/T 317.2-2018). However, standards for the simultaneous determination of multiple elements in blood by ICP-MS remain limited. For instance, Determination of Chromium, Cadmium, Arsenic, Thallium and Lead in Blood — ICP-MS (SF/Z JD0107012-2011) requires sample digestion prior to analysis, making it less suitable for rapid analysis of clinical blood samples.
Given the increasing need in clinical laboratories for rapid, multi-element determination, this study presents a method based on triple quadrupole ICP-MS (ICP-MS/MS) for the simultaneous measurement of nine elements—Ca, Mg, As, Cu, Fe, Mn, Pb, Se, and Zn—in blood. The method requires no digestion; diluted blood samples can be directly introduced for analysis, enabling fast and convenient detection. Experimental results show that all elements exhibit excellent linearity with correlation coefficients (r) greater than 0.999. Method detection limits range from 0.00008 to 0.01624 mg/kg, precision is better than 2.51%, and spiked recoveries fall within 88.41%–112.90%. This method is stable and reliable, providing robust technical support for the determination of trace elements in blood.
Keywords: ICP-MS/MS; blood; oxygen reaction mode; collision mode; trace element concentrations
2. Experimental Section
2.1 Instruments
Figure 1 Inductively Coupled Plasma Mass Spectrometer (ICP-MS/MS)
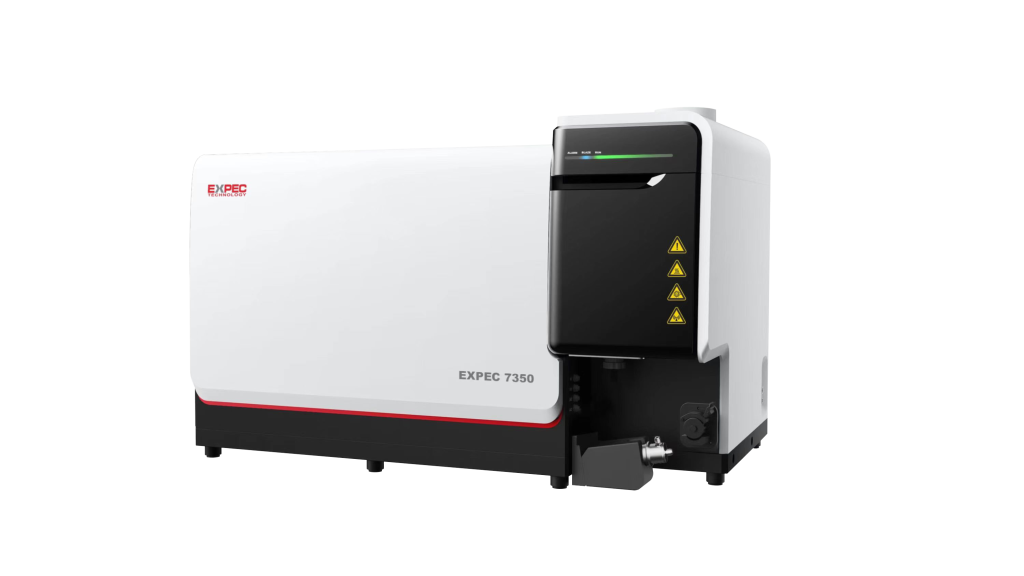
| Model:EXPEC 7350 ICP-MS/MS |
| Configuration: Standard quartz sample introduction system. |
Table 1 Operating parameters of the ICP-MS/MS system
| Instrument Parameter | Setting | Instrument Parameter | Setting |
| Plasma power | 1550 W | Collision gas (He) | 1.57 mL/min |
| Cooling gas | 14.0 L/min | Peristaltic pump speed | 25 r/min |
| Auxiliary gas | 1.0 L/min | Dwell time | 20 ms |
| Nebulizer gas | 0.895 L/min | Sampling depth | 2.78 mm |
| Makeup gas | 0.20 L/min | Cell bias voltage | -23 V |
| Reaction gas-O2 | 0.210 mL/min | Extraction lens voltage | -188 V |
2.2 Reagents and Standards
Reagents: Triton X-100, ultrapure nitric acid, ultrapure isopropanol, and ultrapure water (resistivity ≥18.2 MΩ·cm at 25 °C).
Standard solutions: Multi-element mixed standard solution (1000 μg/mL, National Research Center for Nonferrous Metals, China) and multi-element internal standard solution.
3. Sample Preparation and Calibration Curve Construction
3.1 Sample Preparation
(1) Preparation of blood sample diluent: A diluent consisting of 0.5% nitric acid, 0.01% Triton X-100, and 2% isopropanol was prepared as follows: 5 mL nitric acid, 0.1 mL Triton X-100, and 20 mL isopropanol were added to a volumetric flask and diluted to 1000 mL with ultrapure water, followed by thorough mixing.
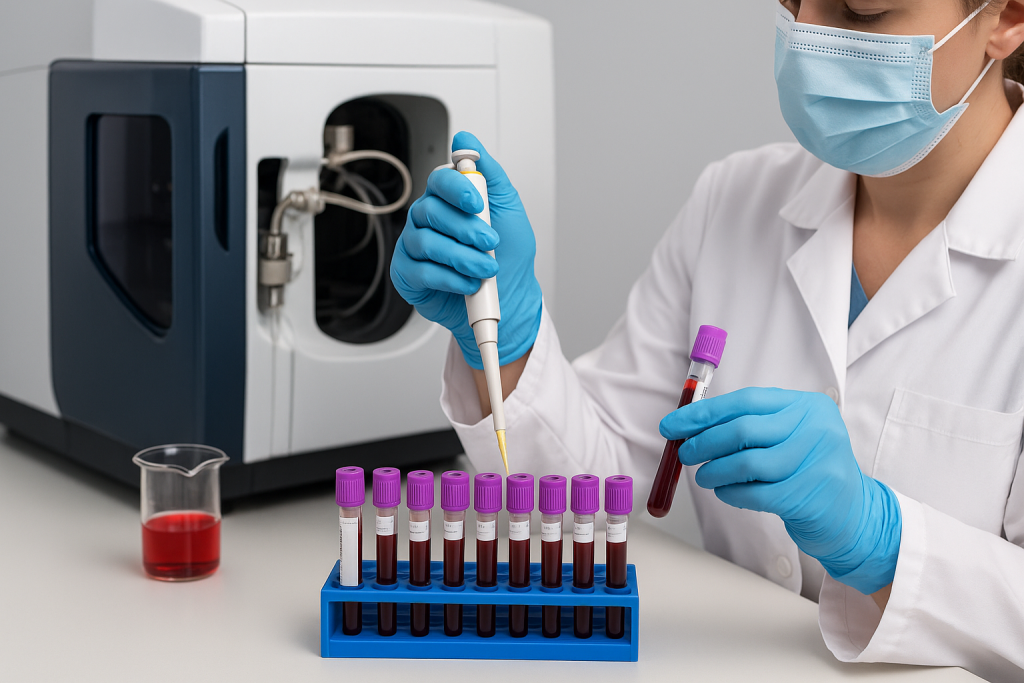
(2) Pretreatment of blood samples: A 0.5 mL aliquot of whole blood was diluted to 10 mL using the prepared diluent. The mixture was shaken gently, vortexed for 10 minutes, and centrifuged at 5000 r/min for 10 minutes. The supernatant was then collected for ICP-MS/MS analysis.
Note: The blood sample must be thoroughly mixed before pipetting.
3.2 Calibration Curve
Mixed standard solutions were prepared by accurately pipetting single-element standard stock solutions of Ca, Mg, Fe, As, Cu, Mn, Pb, Se, and Zn, followed by dilution to obtain the working standards. The concentration gradients for the calibration curves are shown in the table below:
Table 2 Concentration gradients for calibration standards
| Element | Concentration range for calibration standards:μg/L |
| Ca、Mg、Fe | 0.0/5.0/10.0/50.0/100.0/500.0/1000.0/5000.0 |
| As、Cu、Mn、Pb、Se、Zn | 0.0/0.50/1.0/5.0/10.0/50.0/100.0/500.0 |
4. Results and Discussion
4.1 Calibration Curves and Limits of Detection
Within the concentration ranges listed in Table 2, all analytes showed excellentlinearity, with correlation coefficients (r) greater than 0.999. To determine the limits of detection (LODs), the full-procedure blank was analyzed 11 consecutive times, and the LOD for each element was calculated as three times the standard deviation multiplied by the dilution factor. The results are summarized in Table 3. Table 3 also lists the monitored mass-to-charge ratios for each element, the analytical mode (collision or reaction), and the linearity (expressed as the correlation coefficient r). Representative calibration curves are provided in the Appendix.
Table 3 Monitored masses, correlation coefficients, and limits of detection for the target elements
| Element | Mass-to-charge ratio | Mode | Correlation coefficient | Instrument LOD (μg/L) | Method LOD (mg/kg) |
| Mg | 24 | Q2-He | 0.9997 | 0.059 | 0.00118 |
| Ca | 44 | Q2-He | 0.9999 | 0.812 | 0.01624 |
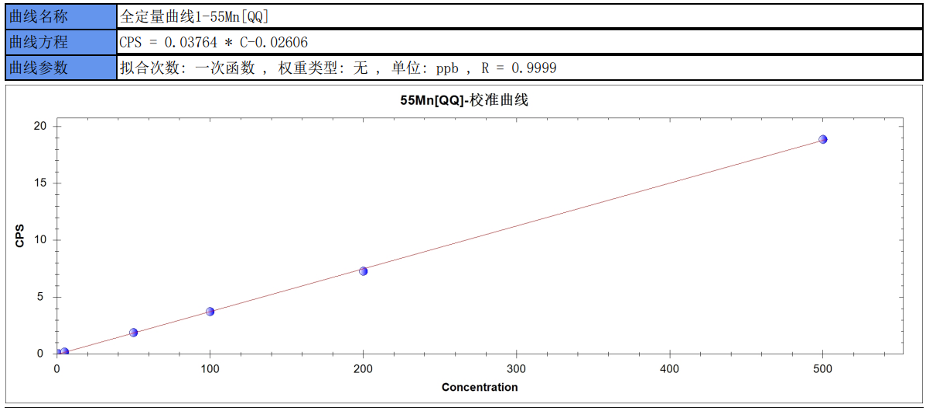
| Mn | 55→55 | QQ-He | 0.9999 | 0.020 | 0.0004 |
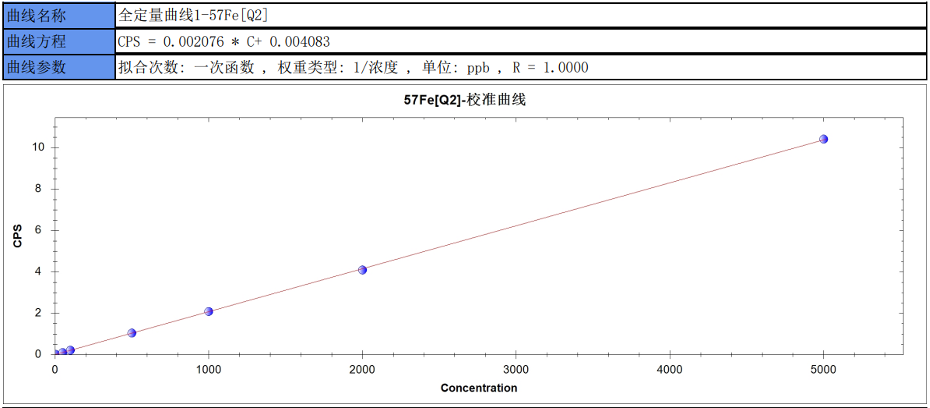
| Fe | 57 | Q2-He | 1.0000 | 0.350 | 0.007 |
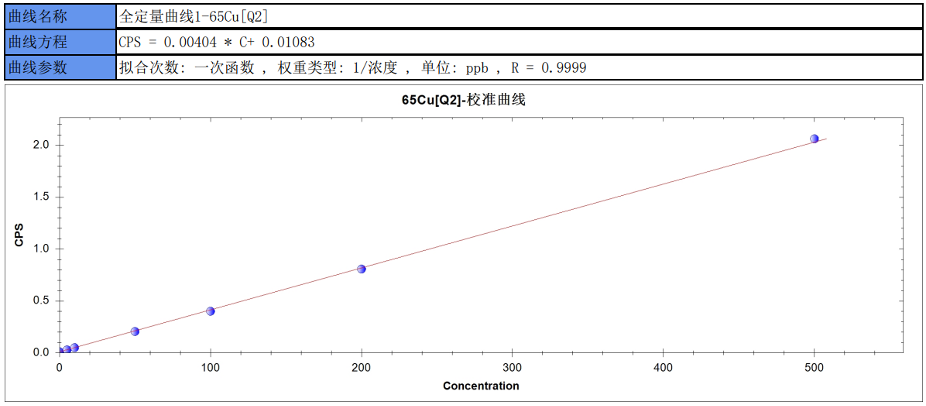
| Cu | 65 | Q2-He | 0.9999 | 0.025 | 0.0005 |
| Zn | 66 | Q2-He | 1.0000 | 0.094 | 0.00188 |
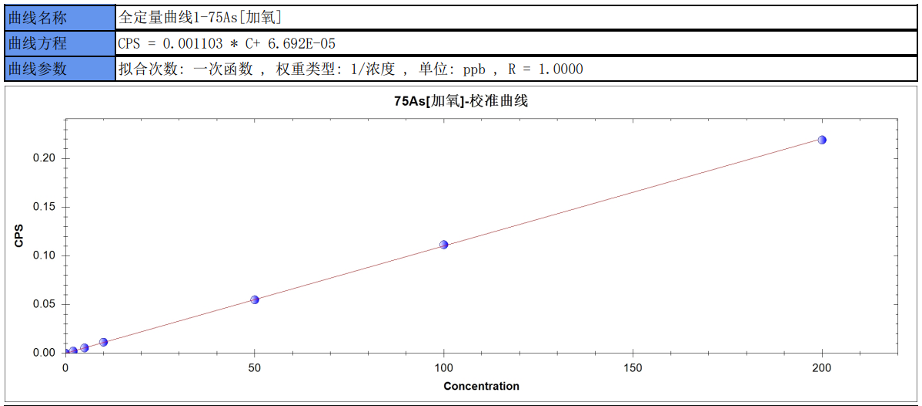
| As | 75→91 | QQ-O₂ mass-shift | 1.0000 | 0.040 | 0.0008 |
| Se | 78 | Q2-He | 1.0000 | 0.224 | 0.00448 |
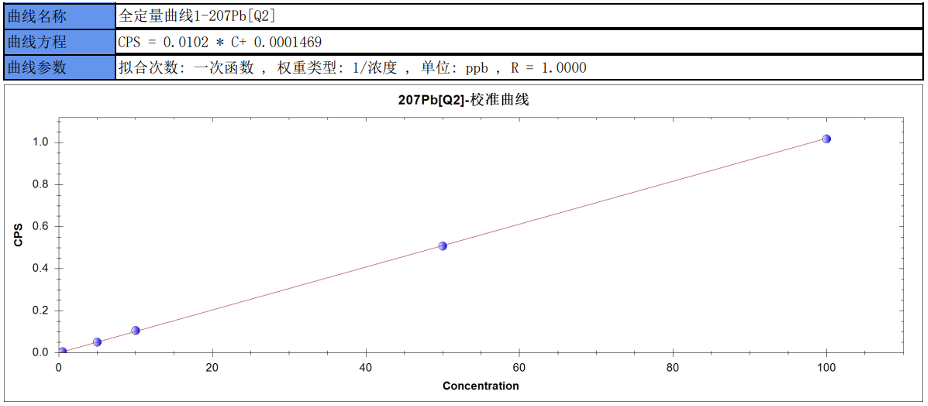
| Pb | 207 | Q2-He | 1.0000 | 0.004 | 0.00008 |
4.2 Method Precision
To evaluate the stability and repeatability of the analytical method, seven prepared blood samples were analyzed under the same conditions. The precision results for each element are summarized in Table 4. The relative standard deviations (RSDs) for all measured elements were better than 2.51%, demonstrating that the method exhibits excellent precision.
Table 4 Method precision(μg/L)
| Sample Name | Mg [Q2-He] | Ca [Q2-He] | Mn [QQ-He] | Fe [Q2-He] | Cu [Q2-He] | Zn [Q2-He] | As [QQ-O₂ mass-shift] | Se [Q2-He] | Pb [Q2-He] |
| Blood-1 | 41864 | 61388 | 25.61 | 303740 | 828 | 4920 | 1.21 | 96.02 | 27.44 |
| Blood-1 | 41968 | 60570 | 23.87 | 316980 | 879 | 5144 | 1.28 | 94.58 | 27.13 |
| Blood-1 | 41916 | 60979 | 24.74 | 310360 | 853 | 5032 | 1.24 | 95.3 | 27.28 |
| Blood-1 | 41901 | 61318 | 24.61 | 303740 | 828 | 4920 | 1.22 | 96.12 | 27.64 |
| Blood-1 | 41892 | 61570 | 24.87 | 316980 | 879 | 5144 | 1.25 | 95.58 | 27.33 |
| Blood-1 | 41892 | 61279 | 24.74 | 310360 | 853 | 5032 | 1.26 | 95.34 | 27.38 |
| Blood-1 | 41954 | 61198 | 25.012 | 309921 | 865 | 5012 | 1.19 | 95.67 | 27.12 |
| Average | 41912 | 61186 | 24.78 | 310297 | 855 | 5029 | 1.24 | 95.52 | 27.33 |
| RSD(%) | 0.09 | 0.53 | 2.09 | 1.74 | 2.49 | 1.82 | 2.51 | 0.54 | 0.66 |
4.3 Analysis of Real Samples
The concentrations of the target elements in the blood samples are summarized in Table 5.
Table 5 Measured concentrations of elements in blood samples (μg/L)
| Sample | Mg [Q2-He] | Ca [Q2-He] | Mn [QQ-He] | Fe [Q2-He] | Cu [Q2-He] | Zn [Q2-He] | As [QQ- O₂ mass-shift] | Se [Q2-He] | Pb [Q2-He] |
| Blood -1 | 41916 | 60979 | 24.74 | 310360 | 853 | 5032 | 1.24 | 95.30 | 27.28 |
| Spiked recovery (%) | 103.37 | 111.07 | 108.72 | 108.50 | 107.59 | 101.01 | 99.16 | 101.70 | 91.44 |
| Blood-2 | 38872 | 60989 | 24.21 | 284400 | 1072 | 5073 | 1.23 | 77.00 | 39.47 |
| Spiked recovery (%) | 110.01 | 112.01 | 112.13 | 89.49 | 100.20 | 102.03 | 91.71 | 96.83 | 99.30 |
| Blood -3 | 45149 | 67564 | 28.66 | 336440 | 1018 | 4027 | 2.73 | 109.90 | 24.47 |
| Spiked recovery (%) | 110.35 | 111.42 | 110.46 | 109.30 | 104.11 | 100.55 | 100.75 | 106.64 | 92.53 |
| Blood -4 | 45809 | 70545 | 22.16 | 281910 | 1082 | 6089 | 1.95 | 104.31 | 22.07 |
| Spiked recovery (%) | 109.40 | 106.60 | 103.02 | 105.00 | 103.49 | 102.90 | 103.70 | 104.27 | 105.95 |
| Blood -5 | 42879 | 73048 | 28.72 | 283080 | 864 | 5893 | 1.57 | 114.94 | 22.37 |
| Spiked recovery (%) | 111.34 | 107.53 | 112.90 | 94.81 | 99.13 | 93.52 | 93.45 | 100.22 | 91.84 |
| Blood -6 | 45147 | 76166 | 27.18 | 266550 | 924 | 4649 | 1.44 | 70.94 | 36.97 |
| Spiked recovery (%) | 108.83 | 104.30 | 112.88 | 91.11 | 98.51 | 94.02 | 102.92 | 110.54 | 93.35 |
| Blood-7 | 42997 | 70926 | 23.70 | 293020 | 1170 | 4169 | 1.81 | 120.92 | 26.62 |
| Spiked recovery (%) | 109.27 | 111.19 | 110.04 | 89.60 | 105.73 | 95.40 | 102.18 | 112.60 | 93.34 |
| Blood -8 | 46058 | 71089 | 28.90 | 281140 | 1041 | 5415 | 2.02 | 115.12 | 24.44 |
| Spiked recovery (%) | 108.09 | 103.15 | 110.78 | 88.67 | 96.16 | 91.07 | 100.22 | 110.05 | 95.41 |
| Blood -9 | 35271 | 76420 | 22.44 | 287140 | 980 | 5454 | 1.50 | 101.95 | 24.55 |
| Spiked recovery (%) | 110.67 | 111.90 | 112.60 | 91.33 | 95.24 | 91.29 | 101.66 | 110.04 | 88.41 |
| Blood -10 | 43717 | 75327 | 19.89 | 377370 | 850 | 5042 | 2.03 | 101.90 | 32.59 |
| Spiked recovery (%) | 107.75 | 105.19 | 112.04 | 108.69 | 96.12 | 94.25 | 100.76 | 104.55 | 88.96 |
5. Conclusion
In this study, nine elements in blood samples were analyzed using a triple quadrupole inductively coupled plasma mass spectrometer (ICP-MS/MS). The results demonstrated that all calibration curves exhibited excellent linearity, with correlation coefficients exceeding 0.999, and the parallel measurements showed good consistency. Appropriate spike levels were selected for each element, and the corresponding spike recovery rates ranged from 88.41% to 112.90%.
These findings indicate that, for biological samples such as blood with highly complex matrices, operating the instrument in collision mode effectively reduces matrix-induced interferences while maintaining high sensitivity, stability, accuracy, and precision. Overall, the ICP-MS/MS method described herein enables rapid and reliable simultaneous determination of multiple trace elements in blood.
6. Appendix
6.1 Calibration Curves
Mn[QQ-He]
Fe [Q2-He]
Cu[Q2-He]
Zn[Q2-He]

As[QQ-O₂ mass-shift]
Se[Q2-He]

Pb[Q2-He]