
Preface
Air pollution is one of the major global public-health challenges, and emissions from the transportation sector are among its primary contributors. To reduce nitrogen oxide (NOx) emissions from diesel engines, Selective Catalytic Reduction (SCR) and Exhaust Gas Recirculation (EGR) technologies are commonly employed. Aqueous urea solution (AUS 32) plays a critical role in the SCR process as the reactive medium responsible for NOx removal. AUS 32 consists of 32.5% urea dissolved in purified water, stored in a dedicated tank and injected into the vehicle’s exhaust system.
The purity of AUS 32 has a significant impact on NOx conversion efficiency, and substandard solutions can cause damage to the exhaust after-treatment system. Therefore, accurate quantification of inorganic impurities in AUS 32 is of great importance. Current methods for elemental analysis of aqueous urea primarily include spectrophotometry and Atomic Absorption Spectroscopy (AAS). Spectrophotometry requires complex chemical pretreatment and is tedious to operate, while AAS measures each target element sequentially, making the process time-consuming. In contrast, Inductively Coupled Plasma Optical Emission Spectrometry (ICP-OES) requires minimal sample preparation and offers high sensitivity, wide linear dynamic range, low detection limits, and simultaneous multi-element determination. It has thus been widely adopted for qualitative and quantitative analysis of impurity elements in various matrices.
This study refers to the standard “Diesel Engines — NOx Reducing Agent — Aqueous Urea Solution” (GB 29518-2013) and analyzes ten elements—Ca, Fe, Cu, Zn, Cr, Ni, Al, Mg, Na, and K. The instrument used is the EXPEC 6500D ICP-OES produced by EXPEC Technology, which features an excellent linear range, extremely low detection limits, and highly efficient analytical performance, making it well-suited for the analysis of aqueous urea solutions.
Keywords: Automotive urea (AUS 32), ICP-OES, inorganic impurities
Experimental Section
Instrument
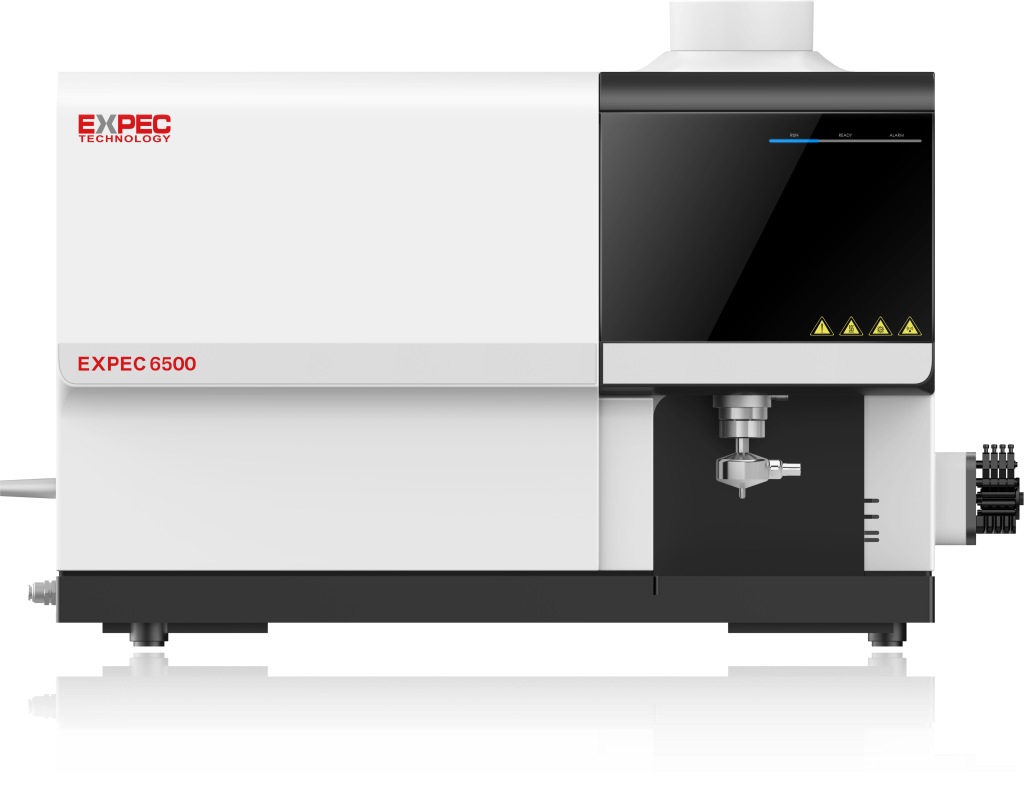
EXPEC 6500D Inductively Coupled Plasma Optical Emission Spectrometer (Figure 1).
Reagents
Nitric acid (ρ = 1.42 g/mL, superior grade).
Ultrapure water: 18.2 MΩ·cm deionized water.
Single-element standard solutions of Ca, Fe, Cu, Zn, Cr, Ni, Al, Mg, Na, and K, each at 1000 mg/L (purchased from the National Center for Nonferrous Metals and Electronic Materials Analysis and Testing).
Sample Preparation
Accurately weigh 4.0000 g of the sample solution and dilute to 40 g with water, corresponding to a 10-fold dilution. Prepare three replicates for each sample, along with a reagent blank. Mix thoroughly and set aside.
Standard Preparation
Prepare a mixed multi-element stock solution containing all ten elements, followed by stepwise dilution to obtain working standards. The concentrations of the calibration standards are listed in Table 1.
Table 1 Calibration Curve Concentrations
| No | Elements | Concentration / mg·L⁻¹ |
| 1 | Al/Ca/Cr/Cu/Fe/K/Mg/Na/Ni/Zn | 0/0.005/0.01/0.02/0.05/0.1/0.2/0.5 |
Instrument Parameters
The operating parameters of the EXPEC 6500D Inductively Coupled Plasma Optical Emission Spectrometer (ICP-OES) are listed in Table 2.
Table 2 ICP-OES Operating Parameters
| Parameter | Setting |
| Pump speed (rpm) | 50 |
| RF power (W) | 1150 |
| Auxiliary gas (L/min) | 1.0 |
| Viewing mode | Axial |
| Nebulizer gas (L/min) | 0.6 |
| Cooling gas (L/min) | 12 |
| Analysis time (s) | Smart integration |
Results and Discussion
Calibration Curves and Determination of Detection Limits
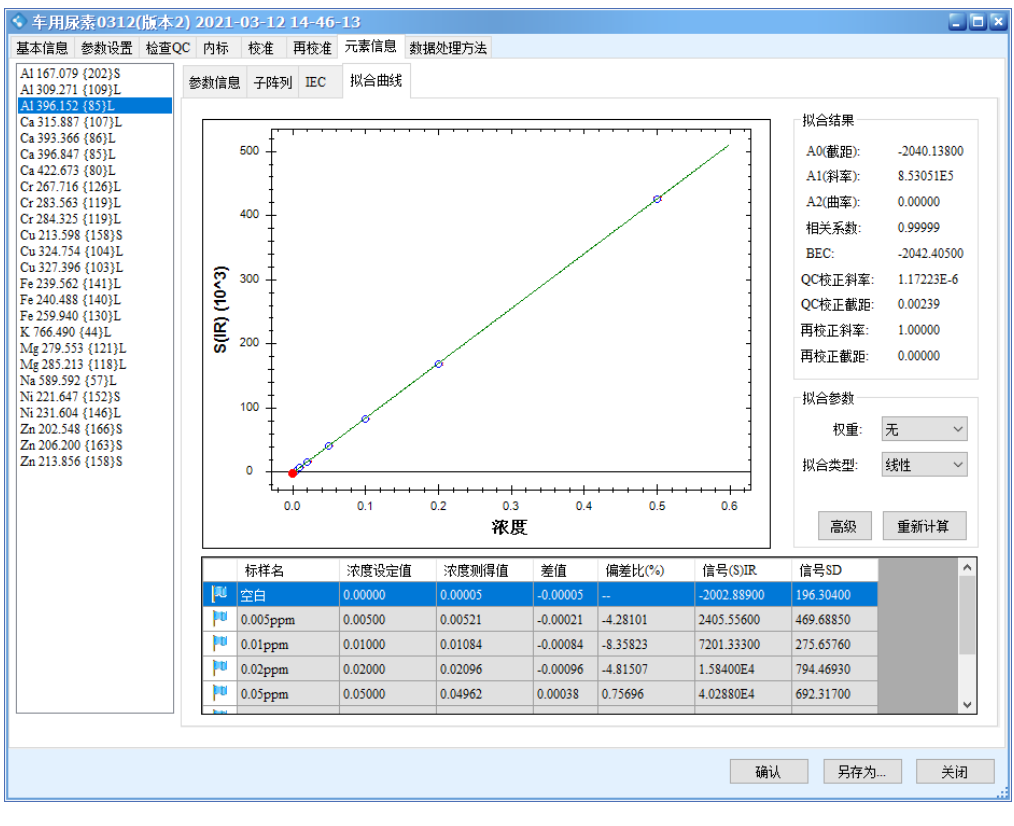
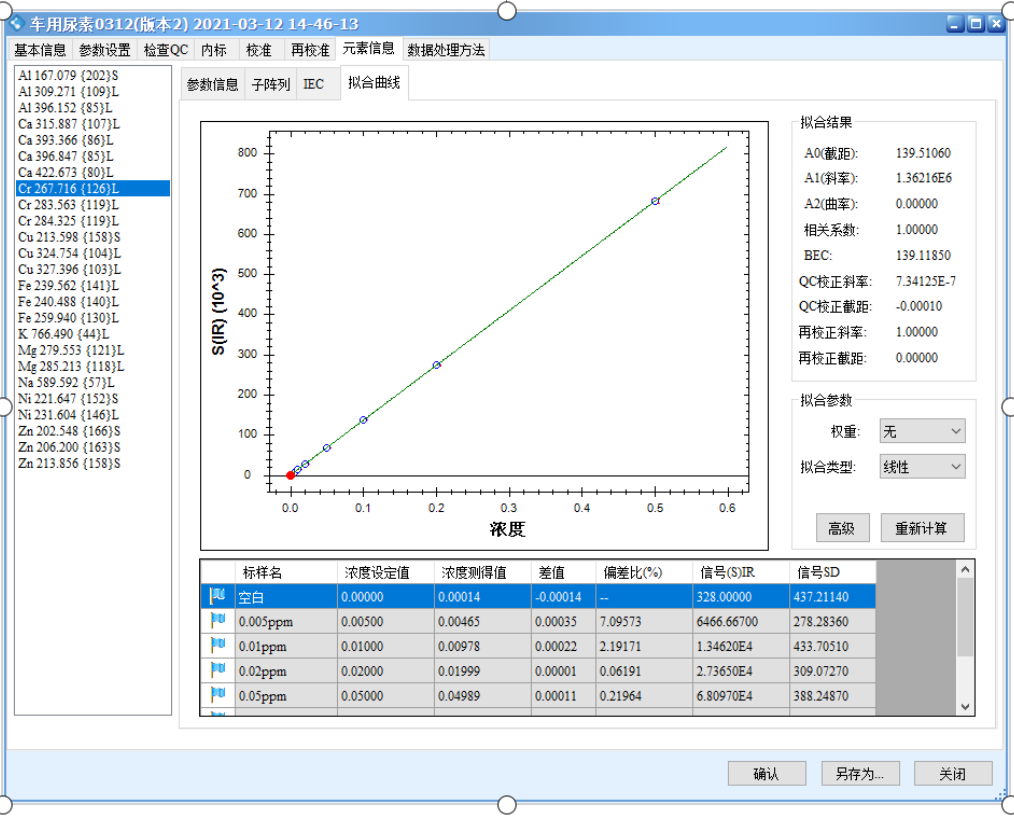
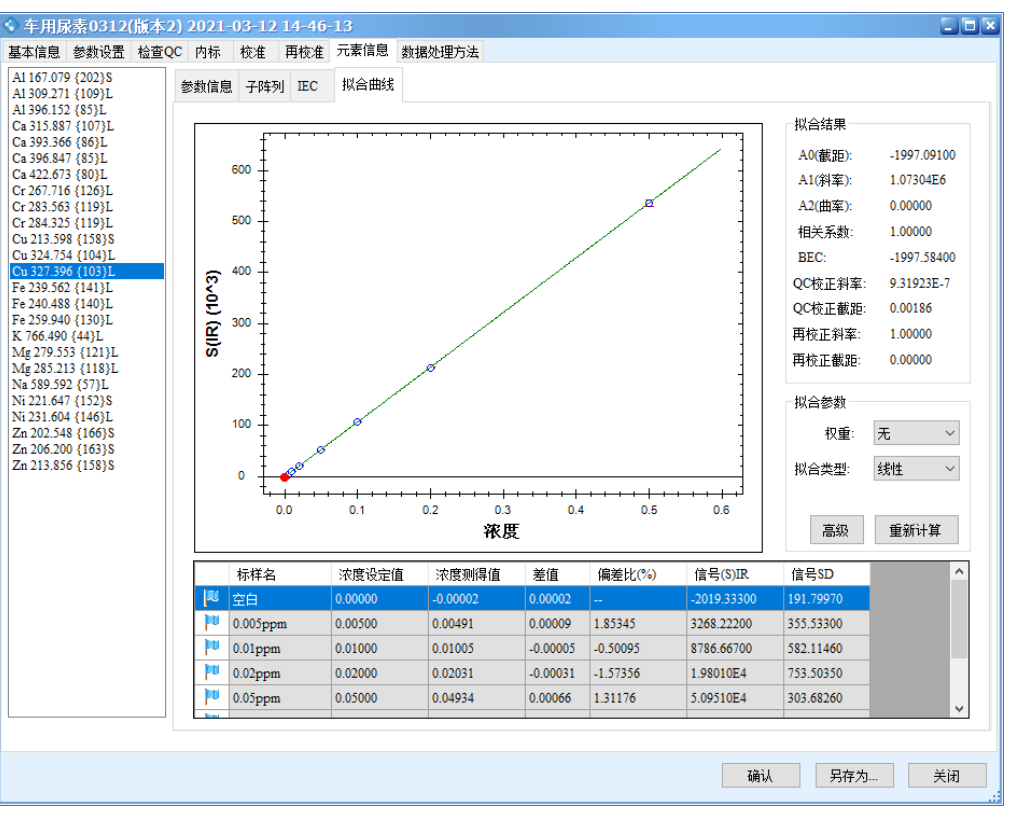
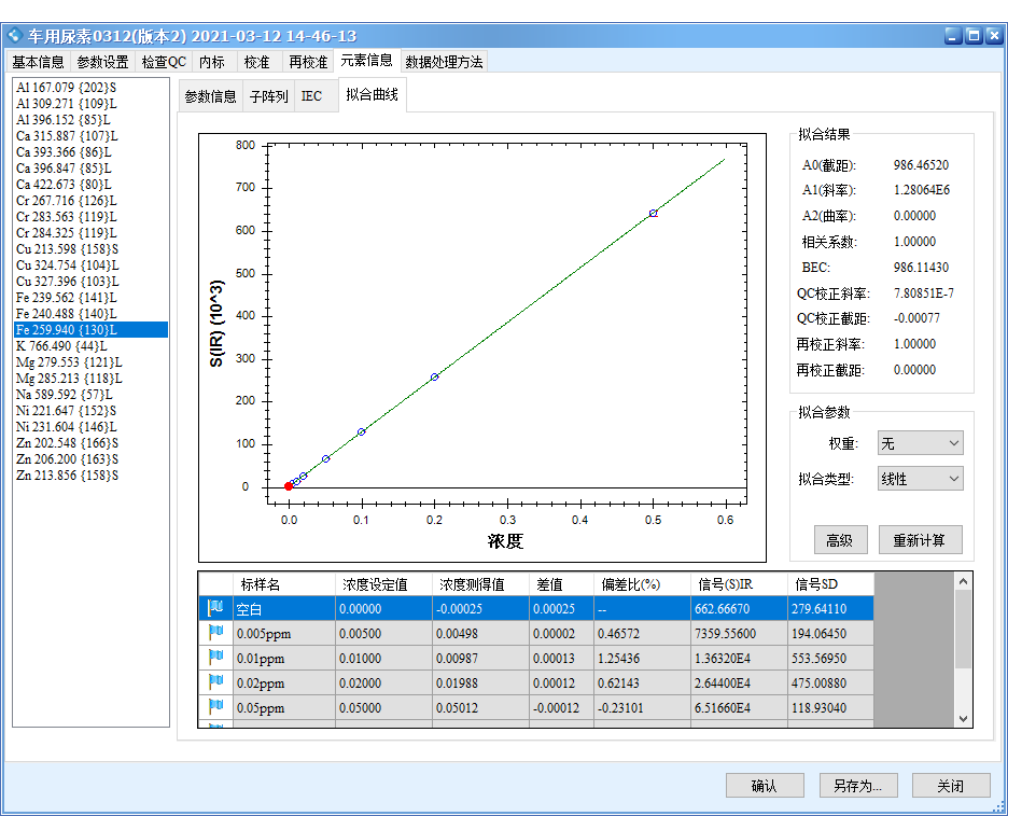
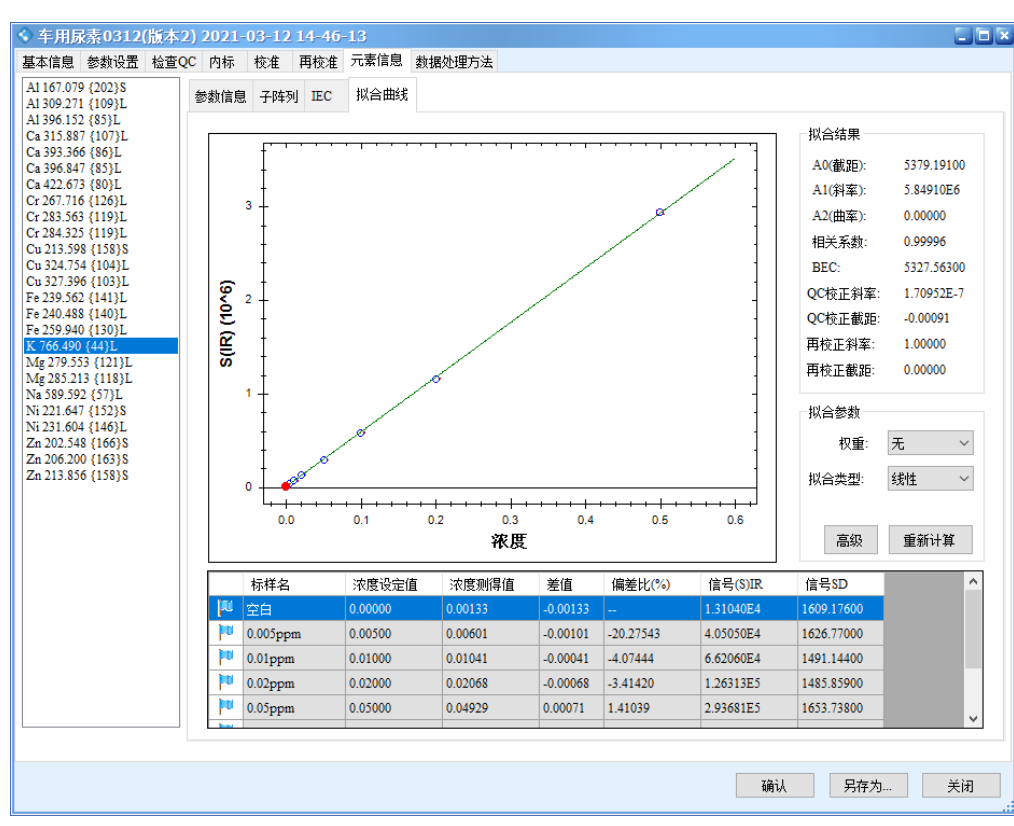
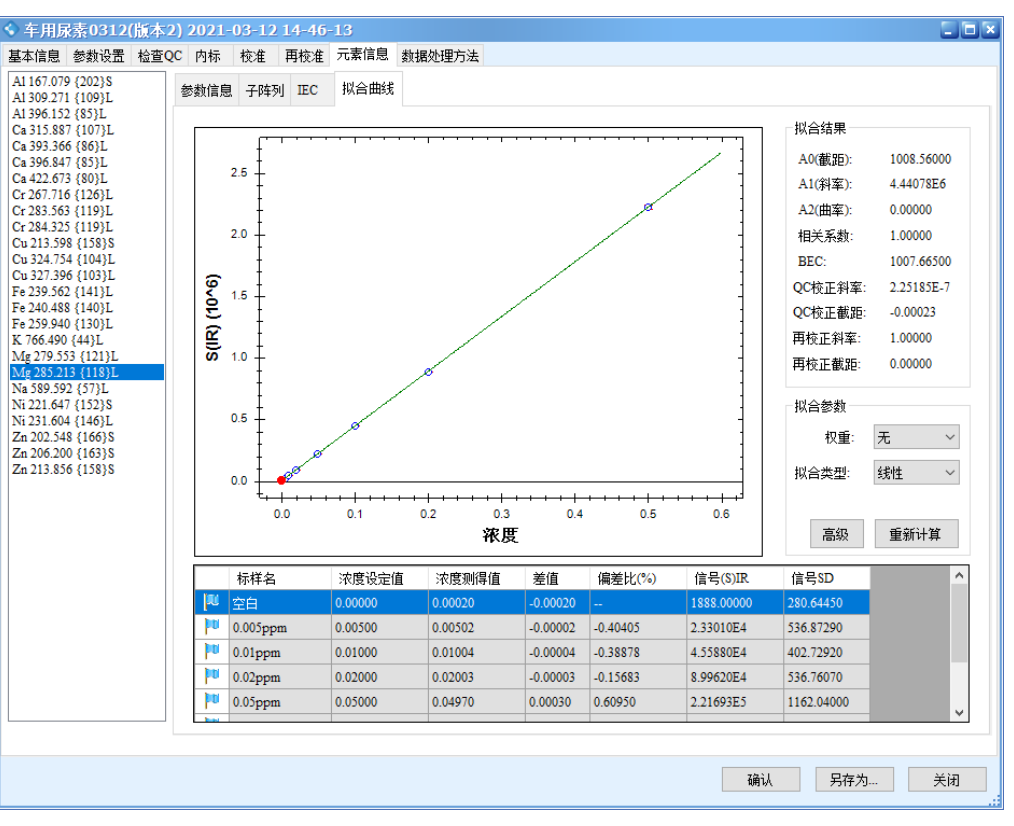
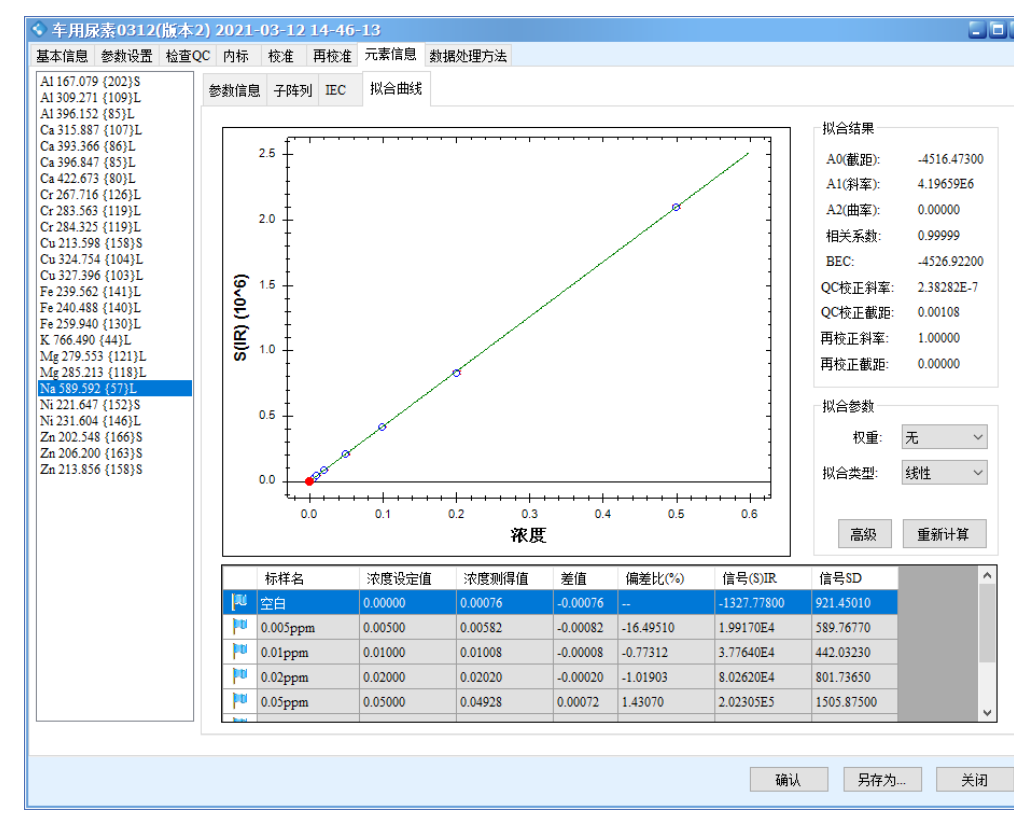
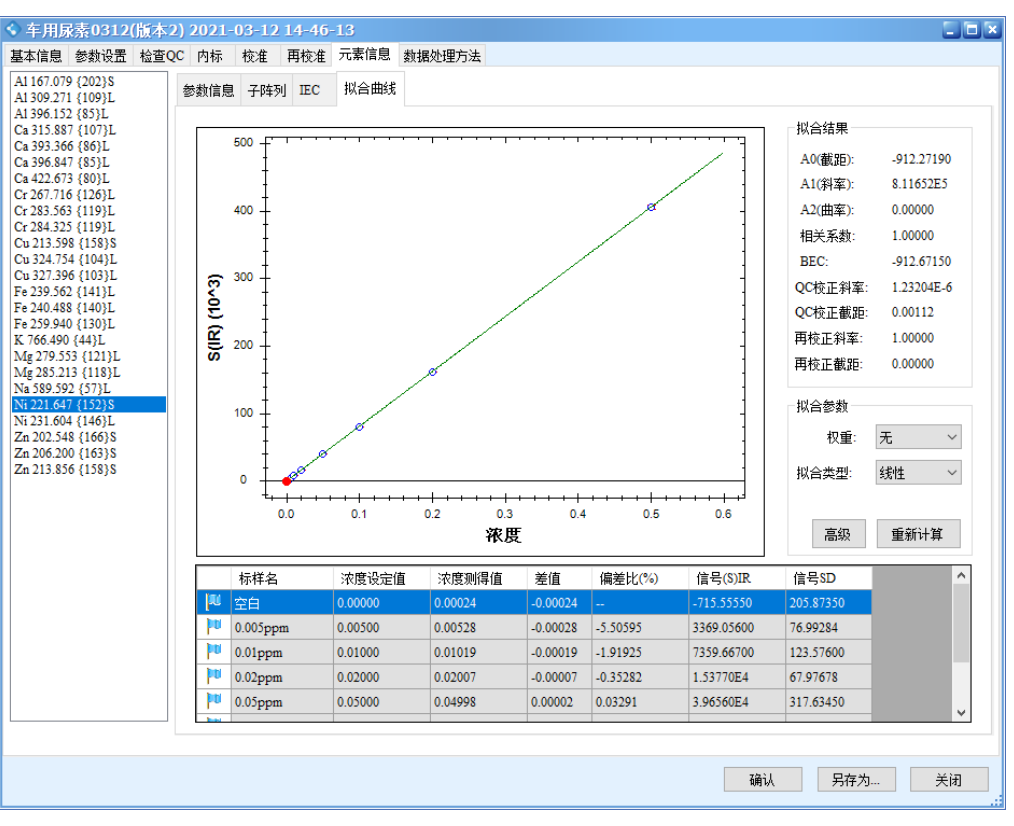
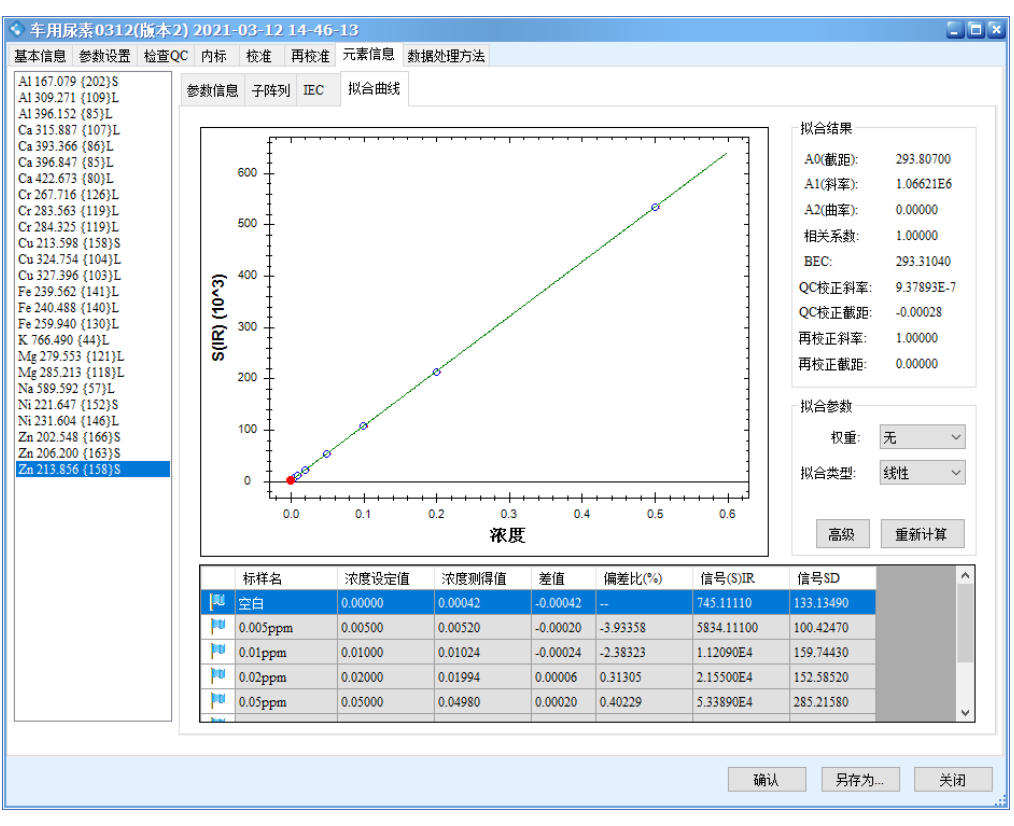
Appropriate analytical wavelengths were selected for the ten target elements, and calibration curves were established using the prepared standards. The reagent blank was analyzed consecutively eleven times, and the method detection limits (MDLs) for each element were calculated accordingly.
The results show that all calibration curves exhibit excellent linearity, with correlation coefficients r > 0.9999. The linear regression coefficients and method detection limits are summarized in Table 3, and the calibration curves are shown in Figure 2.
Table 3 Correlation Coefficients and Limits of Quantification for Each Element
| Elements | Analytical Wavelength (nm) | Correlation Coefficient (r) | Limit of Quantification (mg·L⁻¹) |
| Al | 3961(85)L | 0.99999 | 0.0499 |
| Ca | 4226(80)L | 0.99994 | 0.0214 |
| Cr | 2677(126)L | 1.00000 | 0.0156 |
| Cu | 3273(103)L | 1.00000 | 0.0244 |
| Fe | 2599(130)L | 1.00000 | 0.0139 |
| K | 7664(44)L | 0.99996 | 0.0103 |
| Mg | 2852(118)L | 1.00000 | 0.0066 |
| Na | 5895(57)L | 0.99999 | 0.0172 |
| Ni | 2216(152)S | 1.00000 | 0.0120 |
| Zn | 2138(158)S | 1.00000 | 0.0066 |
Figure 2 Calibration Curves of the Elements
Precision
A 0.01 mg/L mixed standard solution was measured ten consecutive times (n = 10), and the results are summarized in Table 4. The data indicate that the method maintains high precision even at extremely low concentrations, demonstrating reliable accuracy and suitability for the analysis of inorganic impurities in aqueous urea solutions.
Table 4 Precision Data for Each Element (n = 10)
| Sample | Element / Wavelength | Al3961(85)L | Ca4226(80)L | Cr2677(126)L | Cu3273(103)L | Fe2599(130)L |
| 0.01 mg/LStandard Solution | RSD% | 8.92 | 2.15 | 1.59 | 3.92 | 2.84 |
| Element / Wavelength | K7664(44)L | Mg2852(118)L | Na5895(57)L | Ni2216(152)S | Zn2138(158)S | |
| RSD% | 2.49 | 0.87 | 2.25 | 1.58 | 0.59 |
Results Analysis
Table 5 Measured Concentrations of Each Element (mg·L⁻¹) and Spike Recovery Rates
| Sample | Measurement Sequence | Al3961(85)L | Ca4226(80)L | Cr2677(126)L | Cu3273(103)L | Fe2599(130)L |
| Urea Solution | Parallel Sample 1 | ≤0.0499 | 0.0595 | 0.0875 | ≤0.0244 | ≤0.0139 |
| Parallel Sample 2 | ≤0.0499 | 0.0605 | 0.0885 | ≤0.0244 | ≤0.0139 | |
| Mean | / | 0.0600 | 0.0880 | / | / | |
| RSD% | / | 1.14 | 0.77 | / | / | |
| Recovery% | 98.6 | 103 | 102 | 109 | 104 | |
| Measurement Sequence | K7664(44)L | Mg2852(118)L | Na5895(57)L | Ni2216(152)S | Zn2138(158)S | |
| Parallel Sample 1 | ≤0.0103 | ≤0.0066 | 0.1220 | 0.0855 | ≤0.0066 | |
| Parallel Sample 2 | ≤0.0103 | ≤0.0066 | 0.1189 | 0.0865 | ≤0.0066 | |
| Mean | / | / | 0.1205 | 0.0860 | / | |
| RSD% | / | / | 1.80 | 0.79 | / | |
| Recovery% | 98.8 | 93.6 | 97.5 | 99.1 | 101 |
Based on the results in Table 5, the concentrations of all impurity elements in the urea solution are significantly below the limits specified in the standard, and several elements fall below the method detection limits. After spiking the sample at 0.2 ppm, the recovery rates ranged from 93.6% to 109%, indicating good reliability of the method.
Conclusion
In this study, the EXPEC 6500D ICP-OES was used to quantify all inorganic impurity elements in automotive urea solution. The calibration curves showed excellent linearity with correlation coefficients r > 0.9999, and spike recoveries ranged from 93.6% to 109%, demonstrating accurate quantification. Moreover, the MDLs of all elements were far below the limit values specified in GB 29518-2013.
Therefore, the EXPEC 6500D ICP-OES provides a robust and reliable analytical approach for the determination of impurities in AUS 32, offering strong application potential in routine quality control.
Reference:
Standardization Administration of China. Diesel Engines — NOx Reducing Agent — Aqueous Urea Solution: GB 29518-2013 [S]. Beijing: China Standards Press, 2013.