
1 Preface
The spicy ingredient in peppers is mainly natural capsaicin, which is composed of 14 kinds of capsaicinoids. Among them, natural capsaicin and dihydrocapsaicin account for more than 90% of the total capsaicin. Synthetic capsaicin is a synthetic compound with biological functions similar to natural capsaicin. The active groups in the molecular structure are similar to natural capsaicin. However, in terms of spiciness and price, synthetic capsaicin is more popular, so there is a possibility of illegal use. Edible fats and oils do not come into contact with chili peppers during normal production and processing and do not contain capsaicin. The production level of recycled oil is not enough to completely remove capsaicin. Therefore, the quality of oil can be judged by measuring the capsaicin content in oil.
Based on "BJS 201801 Determination of Capsaicin in Edible Oils and Fats", this article established a rapid and highly sensitive detection method for the determination of three capsaicinoids in edible oils and fats using ultra-high performance liquid chromatography-triple quadrupole tandem mass spectrometer EXPEC 5210.
2 Experimental part
2.1 Standards, reagents, and equipments
Standards: Synthetic capsaicin, natural capsaicin, and dihydrocapsaicin (Tianjin Alta Technology Co., Ltd., stored at -20°C).
Reagents: Methanol, formic acid, acetonitrile, methylene chloride (chromatography grade), sodium hydroxide, concentrated sulfuric acid (analytical
grade), C18 solid phase extraction cartridge (500 mg, 6 mL).
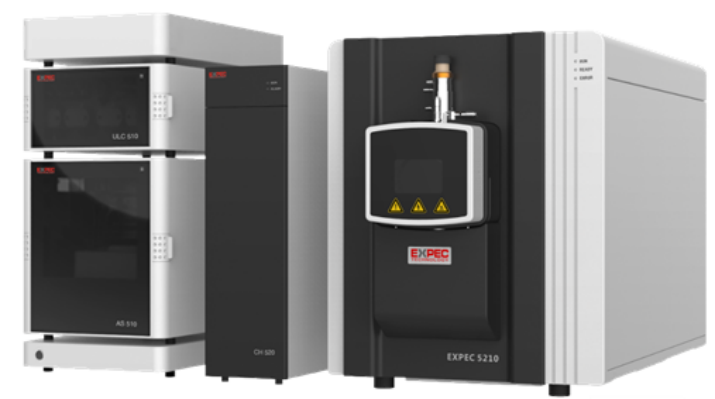
Equipments: ULC 510 Ultra-high-performance liquid chromatograph
(specifically equipped with a binary ultra-high-pressure infusion pump, ultra-high-
pressure autosampler, and column oven), and EXPEC 5210 LC-MSMS.
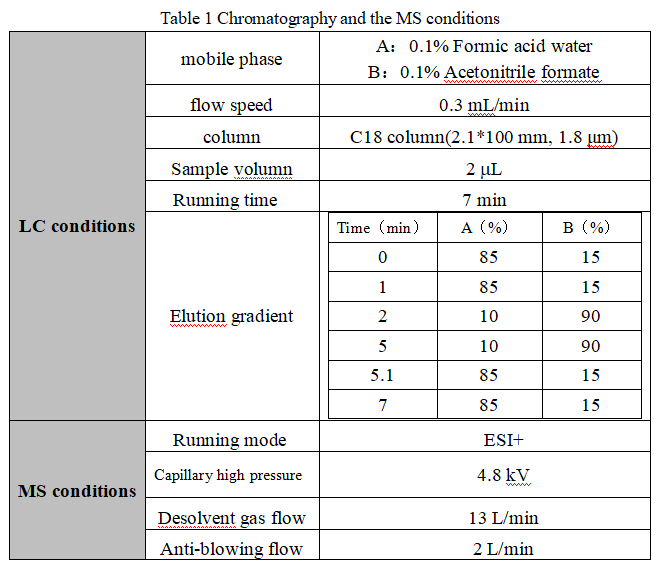
2.2 Liquid phase and mass spectrometry conditions
Table 1 Chromatography and the MS conditionsstandard recovery rate is above 70%; all meet the standard requirements. This method can perform rapid, accurate and sensitive quantitative analysis of capsaicin compounds in edible oils and fats.

Multiple reaction monitoring (MRM), monitoring ion pair, collision voltage (CE) and other parameters for each compound are as follows:
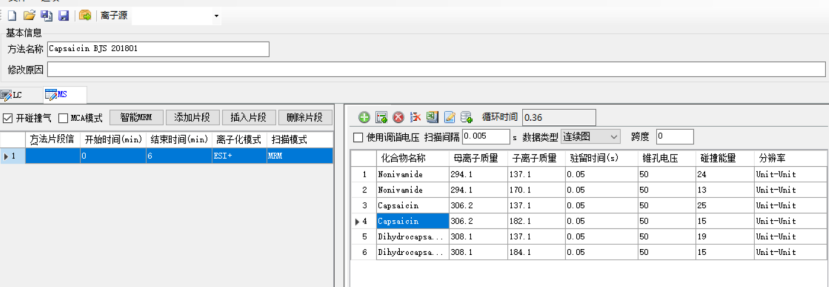
Figure 1 Capsaicin monitoring ion pair and other mass spectrometry parameters
2.3 Sample pretreatment
Weigh 1 g of soybean oil sample into a 15 mL stoppered plastic test tube, add 1 mL of methylene chloride and 3 mL of 2% sodium hydroxide solution, vortex for 10 min, centrifuge at 4000 r/min for 10 min, and take the upper aqueous phase; The residual organic phase was extracted twice with 2 mL of 2% sodium hydroxide solution. After combining the aqueous phases, adjust the pH to 2-3 with dilute sulfuric acid solution. Rinse the C18 SPE cartridge three times with 3 mL acetonitrile, and then rinse it twice with 3 mL pure water. Add the extract solution to the cartridge, 1-2 drops per second. After all the solution passes through the SPE cartridge, add 2 mL Elute with acetonitrile three times, blow to near dryness with nitrogen at 50°C, Rinse the C18 SPE cartridge three times with 3 mL acetonitrile, and then rinse it twice with 3 mL pure water. Add the extract solution to the cartridge, 1-2 drops per second. After all the solution passes through the SPE cartridge, add 2 mL Elute with acetonitrile three times, blow to near dryness with nitrogen at 50°C, 1 mL of methanol was dissolved and passed through a 0.22 m organic microporous filter, and placed in a sampling bottle for LC-MS/MS measurement.
3 Result
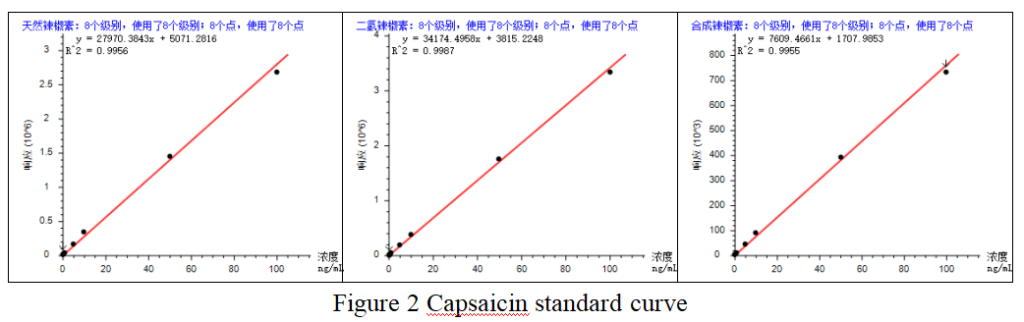
3.1 Linearity
Accurately pipette appropriate amounts of capsaicin mixed standard stock solution into volumetric bottles, Use methanol to dilute it into a standard series of mixed working solutions with contents of 0.1, 0.2, 0.5, 1, 5, 10, 50, and 100 ng/mL. Inject samples according to the above method, take the quantitative ion chromatography peak area of each target substance as the ordinate (Y), and the mass concentration of the target standard solution as the abscissa (X). The standard curve fitted by the external standard method is shown in the figure below: the linear correlation coefficients R2 within the corresponding linear range are all above 0.995, indicating good linearity.
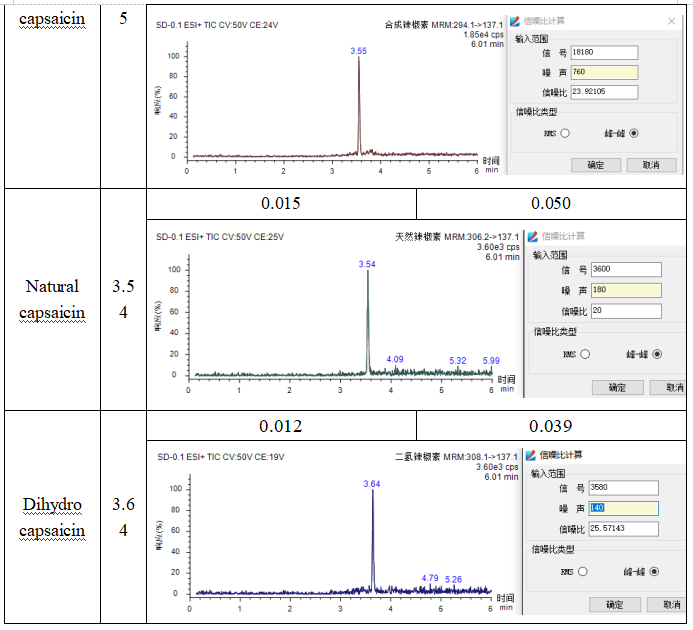
3.2 Sensitivity
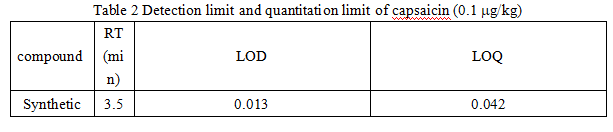
Determine the linear lowest point, follow S/N=3 and S/N=10 to calculate the detection limit and quantitation limit. The results are shown in Table 2 below: the detection limit of capsaicin is 0.012-0.015 mg/kg; the quantitation limit is 0.039-0.050 mg/kg.
Table 2 Detection limit and quantitation limit of capsaicin (0.1 mg/kg)
3.3 Precision
Configure a mixed standard solution of 0.5 ng/mL and 10 ng/mL capsaicin, and inject the sample 6 times continuously to check the repeatability of retention time and peak area. The results are as shown in the figure below: the RSD of the retention time is less than 0.1%, and the RSD of the peak area is less than 4.9 %, the instrument precision is good.
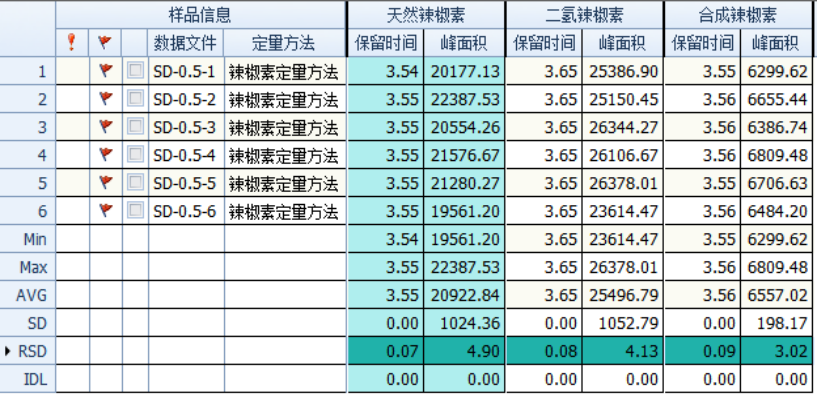
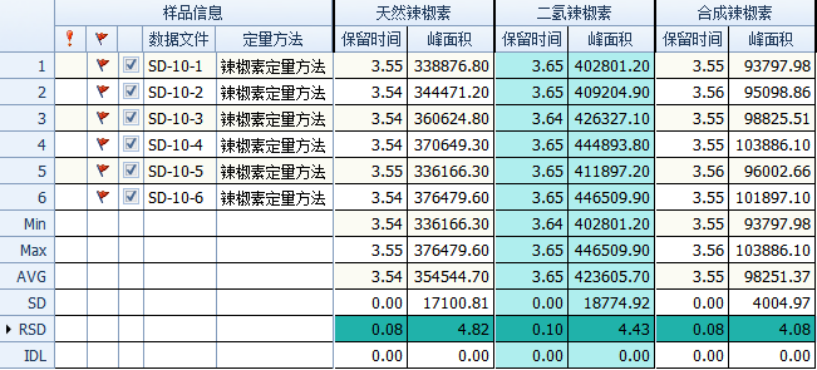
Figure 3 Retention time and peak area stability of 0.5 and 10 ng/mL mixed standard solutions
3.4 Sample test
Take 1g soybean oil sample (n=3), pre-process according to section 2.3 and then run the test on the machine. The blank and sample test results are as shown in the figure below: within the corresponding retention time, none of the three capsaicinoids were detected.
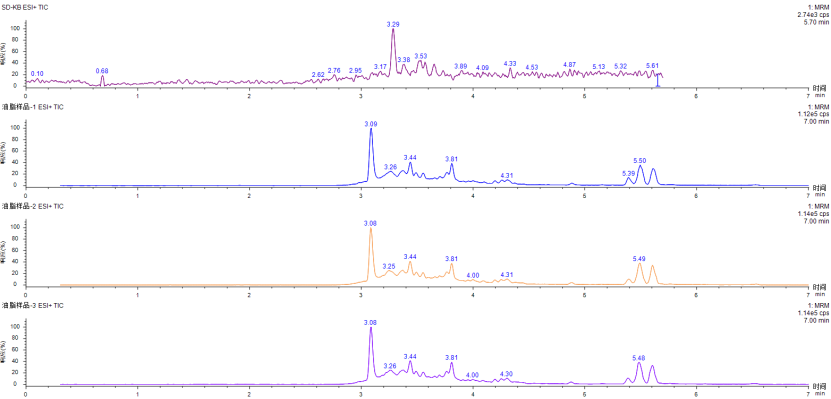
Figure 4 TIC spectra of blank and soybean oil samples

Figure 5 Soybean oil sample batch processing
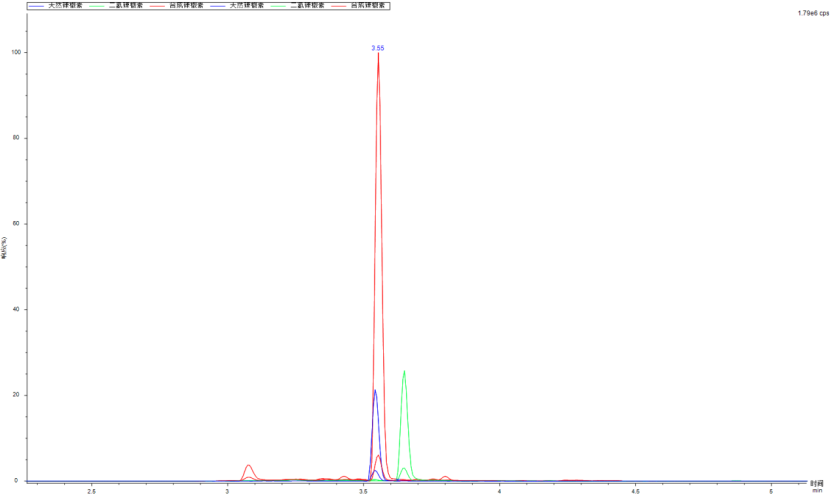
Figure 6 50 ng/mL soybean oil sample spiked MRM overlay spectrum
3.5 Accuracy
Select capsaicin compound standard solutions with spiked concentrations of 5 and 40 ng/mL, use the same sample processing method, and inject 4 consecutive injections to examine the recovery rate of each concentration. The results are shown in the figure below: the recovery rate is above 70%.
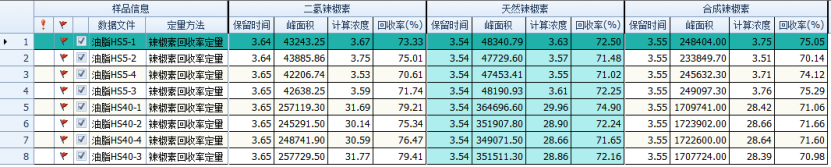
Figure 7 Edible fat spiked recovery rate batch processing
4 Conclusion
This article established a method for the determination of capsaicin compounds in edible oils using the EXPEC 5210 triple quadrupole liquid mass spectrometer of EXPEC Technology, to examine the linearity, sensitivity, precision and recovery rate of the method. The results show that: the standard curves of the three capsaicin compounds have good linearity in the range of 0.1-100 ng/mL, and the correlation coefficients R2 are all greater than 0.995; The detection limit is 0.012-0.015 g/kg, the quantification limit is 0.039-0.050 g/kg; the retention time RSD is within 0.1%, and the peak area RSD is within 4.9%; The standard recovery rate is above 70%; all meet the standard requirements. This method can perform rapid, accurate and sensitive quantitative analysis of capsaicin compounds in edible oils and fats.