Nitrobenzene compounds, a class of nitroaromatic hydrocarbons, are widely used as intermediates in the manufacture of dyes, paints, plastics, explosives, pharmaceuticals, and pesticides. They are highly toxic pollutants that can enter the human body through the respiratory tract, digestive tract, or skin. These compounds mainly affect the blood, liver, and central nervous system—converting hemoglobin into methemoglobin, which loses its oxygen transport capacity and causes hypoxia.
Nitrobenzene compounds in water can significantly impact the self-purification capacity of aquatic systems. Nitrobenzene itself is a persistent organic pollutant with long-term toxicity, while chloronitrobenzenes are mutagenic, carcinogenic, and teratogenic substances often used as intermediates in dyeing and pesticide industries. Dinitrobenzenes are highly flammable, explosive, and extremely toxic; at sufficient concentrations in water, they can cause mass mortality of fish and aquatic organisms. Trinitrotoluene (TNT), a common explosive component, poses both acute and chronic toxicity risks—leading to cataracts, toxic hepatitis, and hematopoietic system damage.
According to China’s Environmental Quality Standards for Surface Water (GB 3838-2002), nitrobenzene compounds such as nitrobenzene, dinitrobenzene, 2,4-dinitrotoluene, 2,4,6-trinitrotoluene, and chloronitrobenzenes are subject to strict concentration limits. Therefore, establishing accurate monitoring methods for nitrobenzene compounds in water is of great importance for environmental protection and water quality management.
In general, analysis of nitrobenzene compounds in water involves liquid–liquid extraction or solid-phase extraction to concentrate target analytes, followed by gas chromatography (GC) or gas chromatography–mass spectrometry (GC-MS) detection. This study, based on HJ 716-2014 – Determination of Nitrobenzene Compounds in Water by Gas Chromatography–Mass Spectrometry, utilized the EXPEC 3750 GC-MS to analyze 15 nitrobenzene compounds in water samples. The experimental results demonstrated excellent linearity with correlation coefficients (R²) greater than 0.998, and precision ranging from 1.40% to 3.52% RSD. With a sample volume of 1.0 L, the method detection limits (MDLs) ranged from 0.006 μg/L to 0.022 μg/L, and the limits of quantification (LOQs) ranged from 0.024 μg/L to 0.088 μg/L. This method fully meets the requirements for the qualitative and quantitative determination of 15 nitrobenzene compounds in water samples.
Keywords: EXPEC 3750 GC-MS, nitrobenzene compounds, water analysis, gas chromatography–mass spectrometry, HJ 716-2014, environmental monitoring, pollutant detection, method detection limit, persistent organic pollutants, water quality management
Instruments and Reagents
Instruments:Gas Chromatography–Mass Spectrometer (EXPEC 3750 GC-MS, Hangzhou EXPEC Technology Co., Ltd.)
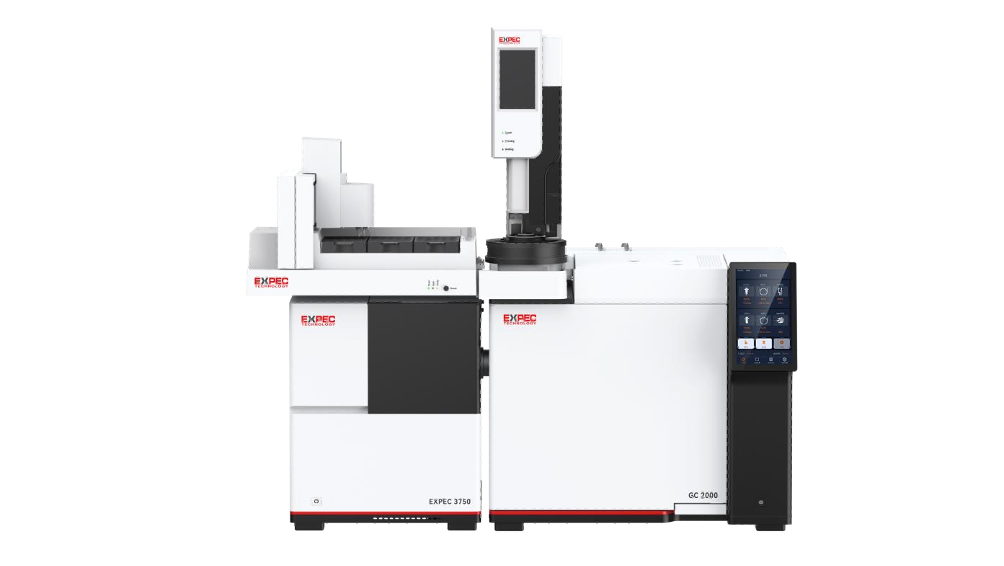
EXPEC 3750 GC-MS Appearance
Reagents and Materials
Standard stock solutions of 15 nitrobenzene compounds (500 mg/L, dissolved in a 1:1 mixture of dichloromethane and methanol) — see Table 1 for details. Standard stock solution of 1-bromo-2-nitrobenzene (100 mg/L, methanol solvent), Dichloromethane, pesticide-residue grade.
Table 1. Basic Information of 15 Nitrobenzene Compounds
| Compounds | CAS NO. | Quantitative Ion(m/z) | Qualitative Ions (m/z) |
| Nitrobenzene | 98-95-3 | 77 | 123、65 |
| 2-Nitrotoluene | 88-72-2 | 120 | 65、91 |
| 3-Nitrotoluene | 99-08-1 | 91 | 65、137 |
| 4-Nitrotoluene | 99-99-0 | 137 | 65、91 |
| 1-Chloro-3-nitrobenzene | 121-73-3 | 111 | 75、157 |
| 1-Chloro-4-nitrobenzene | 100-00-5 | 75 | 111、157 |
| 1-Chloro-2-nitrobenzene | 88-73-3 | 75 | 111、157 |
| 1,4-Dinitrobenzene | 100-25-4 | 168 | 75、50、122 |
| 1,3-Dinitrobenzene | 99-65-0 | 168 | 75、50、92 |
| 2,6-Dintrotoluene | 606-20-2 | 165 | 63、89 |
| 1,2-Dinitrobenzene | 528-29-0 | 168 | 63、50、76 |
| 2,4-Dintrotoluene | 121-14-2 | 165 | 63、89 |
| 1-Chloro-2,4-dinitrobenzene | 97-00-7 | 202 | 75、110 |
| 3,4-Dintrotoluene | 610-39-9 | 182 | 63、89 |
| 2,4,6-Trinitrotoluene | 118-96-7 | 210 | 89、63 |
Experimental Method
Preparation of Calibration Standards :A certain amount of the nitrobenzene compound standard solutions was diluted with dichloromethane to prepare a series of six calibration concentrations. The mass concentrations of the nitrobenzene compounds were 0.1 μg/mL, 0.5 μg/mL, 1.0 μg/mL, 2.0 μg/mL, 5.0 μg/mL, and 10.0 μg/mL. A working solution of 1-bromo-2-nitrobenzene was added as an internal standard, resulting in an internal standard concentration of 2.0 μg/mL in each calibration solution.
Instrument Reference Conditions:The reference operating parameters of the gas chromatography–mass spectrometry (GC-MS) system are listed in Table 2.
Table 2. Reference Conditions for Gas Chromatography–Mass Spectrometry (GC-MS)
| Module | Component | Parameter |
| GC | Inlet Temperature | 250 ℃ |
| Injection Volume | 1 μL | |
| Injection Mode | Split:5:1 | |
| Column | DB-5MS, 30 m × 0.25 mm × 0.25 µm | |
| Carrier Gas Flow Rate | 1 mL/min,constant flow | |
| Oven Temperature Program | Initial 60 ℃,ramp at 10 °C/min to 200 °C, then 15 °C/min to 250 °C, hold for 3 min | |
| MS | GC–MS Interface Temperature | 300 ℃ |
| Ion Source Temperature | 280 ℃ | |
| Scan Mode | Scan(40~400)&SIM(Table 1) |
Results and Discussion
According to the reference instrument conditions, 15 nitrobenzene compounds were analyzed. The selected ion chromatogram (SIM) of the 15 nitrobenzene compounds at 1.0 μg/mL is shown in Figure 2. All chromatographic peaks were baseline-separated with sharp and symmetrical peak shapes, ensuring accurate qualitative identification and quantitative determination.
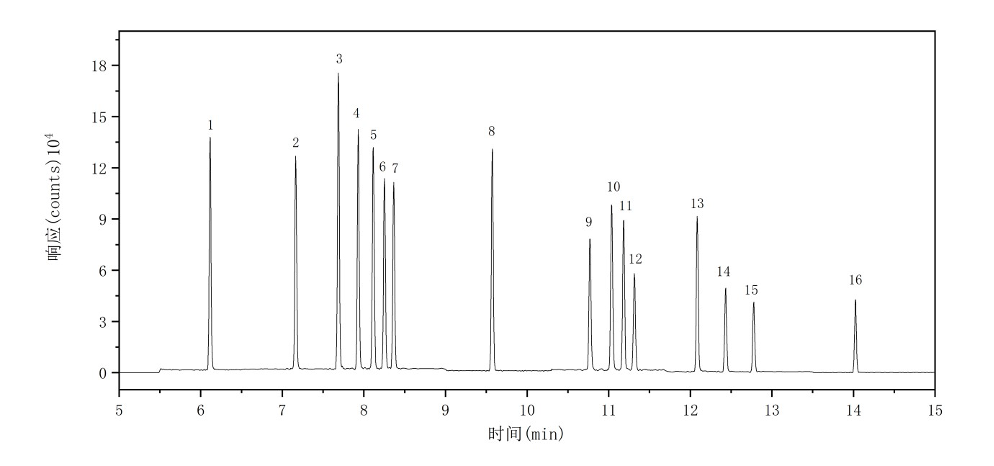
Figure 1. Selected-ion chromatogram of the 15 nitrobenzene compounds
Peak IDs: 1. Nitrobenzene; 2. o-Nitrotoluene; 3. m-Nitrotoluene; 4. p-Nitrotoluene; 5. m-Chloronitrobenzene; 6. p-Chloronitrobenzene; 7. o-Chloronitrobenzene; 8. 1-Bromo-2-nitrobenzene (internal standard, IS); 9. p-Dinitrobenzene; 10. m-Dinitrobenzene; 11. 2,6-Dinitrotoluene; 12. o-Dinitrobenzene; 13. 2,4-Dinitrotoluene; 14. 2,4-Dinitrochlorobenzene; 15. 3,4-Dinitrotoluene; 16. 2,4,6-Trinitrotoluene.
Calibration Curve
Quantification was performed using the internal standard method. The calibration curves of several representative compounds are shown in Table 3. The linear correlation coefficients (R²) of all 15 nitrobenzene compounds were greater than 0.998, meeting the standard analytical requirements (see Table 3).
Table 3. Linear Calibration Equations and Correlation Coefficients of 15 Nitrobenzene Compounds
| Compounds | Retention Time(min) | Calibration Equation | R2 |
| Nitrobenzene | 6.13 | y = 3.1104x + 0.0118 | 0.9993 |
| o-Nitrotoluene | 7.18 | y = 1.5912x - 0.0194 | 0.9997 |
| m-Nitrotoluene | 7.70 | y = 3.3165x - 0.0494 | 0.9996 |
| p-Nitrotoluene | 7.94 | y = 2.2760x - 0.0341 | 0.9998 |
| m-Chloronitrobenzene | 8.13 | y = 1.9173x - 0.0186 | 0.9995 |
| p-Chloronitrobenzene | 8.26 | y = 1.5587x - 0.0206 | 0.9997 |
| o-Chloronitrobenzene | 8.38 | y = 1.5857x - 0.0012 | 0.9997 |
| p-Dinitrobenzene | 10.78 | y = 0.9026x - 0.0575 | 0.9996 |
| m-Dinitrobenzene | 11.05 | y = 1.1851x - 0.1129 | 0.9991 |
| 2,6-Dinitrotoluene | 11.19 | y = 1.8928x - 0.1311 | 0.9996 |
| o-Dinitrobenzene | 11.33 | y = 0.8741x - 0.0689 | 0.9995 |
| Compound | Retention Time(min) | Calibration Equation | R2 |
| 2,4-Dinitrotoluene | 12.10 | y = 2.0872x - 0.1768 | 0.9991 |
| 2,4-Dinitrochlorobenzene | 12.45 | y = 0.8929x - 0.1059 | 0.9985 |
| 3,4-Dinitrotoluene | 12.79 | y = 1.0283x - 0.1146 | 0.9990 |
| 2,4,6-Trinitrotoluene | 14.04 | y = 1.0383x - 0.1046 | 0.9985 |
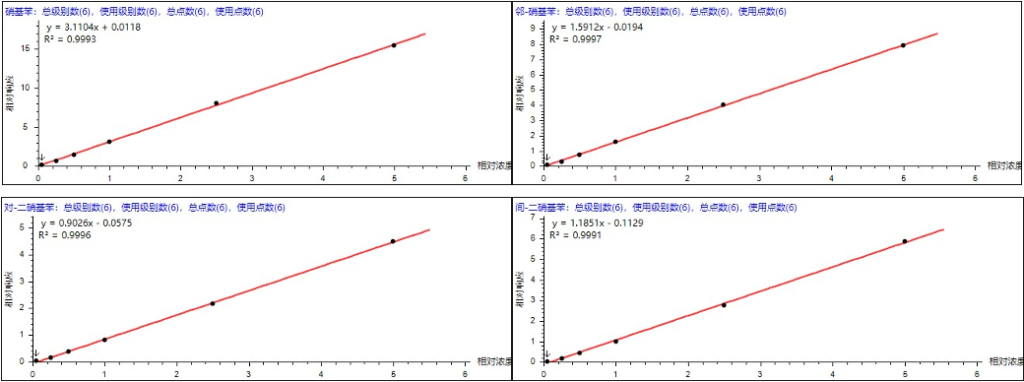
Figure 3. Linear Calibration Curves of Selected Nitrobenzene Compounds
Method Precision
According to the reference instrument conditions, a 1.0 μg/mL standard sample was analyzed consecutively six times to evaluate method precision. The results are shown in Table 4. The precision (RSD) for the 15 nitrobenzene compounds ranged from 1.40% to 3.52%, demonstrating excellent method stability and repeatability.
Table 4. Method Precision for 15 Nitrobenzene Compounds (Unit: μg/mL)
| Compound | Measured Concentration(μg/mL) | RSD(%) | |||||||
| Rep.1 | Rep.2 | Rep. 3 | Rep.4 | Rep.5 | Rep.6 | Mean | |||
| Nitrobenzene | 1.023 | 1.042 | 1.014 | 1.041 | 1.028 | 1.026 | 1.029 | 1.04 | |
| o-Nitrotoluene | 1.004 | 1.008 | 0.997 | 0.996 | 0.995 | 0.999 | 1.000 | 0.53 | |
| m-Nitrotoluene | 0.996 | 1.011 | 1.000 | 0.988 | 0.995 | 0.994 | 0.997 | 0.80 | |
| p-Nitrotoluene | 1.010 | 0.988 | 0.995 | 0.987 | 0.994 | 0.980 | 0.992 | 1.03 | |
| m-Chloronitrobenzene | 0.987 | 0.993 | 0.978 | 0.979 | 0.981 | 0.982 | 0.984 | 0.56 | |
| p-Chloronitrobenzene | 0.989 | 1.002 | 0.984 | 0.992 | 0.986 | 0.982 | 0.989 | 0.71 | |
| o-Chloronitrobenzene | 0.980 | 0.997 | 0.970 | 1.000 | 0.987 | 0.983 | 0.986 | 1.14 | |
| p-Dinitrobenzene | 0.899 | 0.885 | 0.896 | 0.908 | 0.887 | 0.882 | 0.893 | 1.10 | |
| m-Dinitrobenzene | 0.919 | 0.889 | 0.907 | 0.907 | 0.891 | 0.885 | 0.900 | 1.50 | |
| 2,6-Dinitrotoluene | 0.927 | 0.915 | 0.912 | 0.907 | 0.906 | 0.904 | 0.912 | 0.93 | |
| o-Dinitrobenzene | 0.883 | 0.876 | 0.894 | 0.887 | 0.868 | 0.873 | 0.880 | 1.10 | |
| 2,4-Dinitrotoluene | 0.893 | 0.885 | 0.881 | 0.888 | 0.862 | 0.870 | 0.880 | 1.31 | |
| 2,4-Dinitrochlorobenzene | 0.892 | 0.862 | 0.857 | 0.881 | 0.859 | 0.880 | 0.872 | 1.64 | |
| 3,4-Dinitrotoluene | 0.871 | 0.870 | 0.878 | 0.866 | 0.852 | 0.862 | 0.866 | 1.01 | |
| 2,4,6-Trinitrotoluene | 0.888 | 0.862 | 0.876 | 0.859 | 0.854 | 0.858 | 0.866 | 1.47 | |
Limit of Detection (LOD)
According to the Technical Guidelines for the Formulation of Environmental Monitoring and Analytical Methods (HJ 168-2020), the method detection limit (MDL) was determined as follows. Seven replicate samples at a concentration of 0.10 μg/mL were analyzed in parallel, and the standard deviation (S) was calculated. The MDL was obtained using the formula: MDL=3.143×S (at a 99% confidence level). The limit of quantification (LOQ) was defined as four times the MDL. When the sample volume was 1.0 L and the final constant volume was 1 mL,
the method achieved MDLs in the range of 0.006 – 0.022 μg/L, and LOQs in the range of 0.024 – 0.088 μg/L,
as summarized in Table 5:
Table 5. Method Detection Limits (MDL) and Limits of Quantification (LOQ) for 15 Nitrobenzene Compounds
| Compound | Retention Time (min) | CAS NO. | Quantitative Ion (m/z) | Qualitative Ions (m/z) | MDL (μg/L) | LOQ (μg/L) |
| Nitrobenzene | 6.13 | 98-95-3 | 77 | 123、65 | 0.006 | 0.024 |
| o-Nitrotoluene | 7.18 | 88-72-2 | 120 | 65、91 | 0.012 | 0.048 |
| m-Nitrotoluene | 7.7 | 99-08-1 | 91 | 65、137 | 0.010 | 0.004 |
| p-Nitrotoluene | 7.94 | 99-99-0 | 137 | 65、91 | 0.022 | 0.088 |
| m-Chloronitrobenzene | 8.13 | 121-73-3 | 111 | 75、157 | 0.006 | 0.024 |
| p-Chloronitrobenzene | 8.26 | 100-00-5 | 75 | 111、157 | 0.009 | 0.036 |
| o-Chloronitrobenzene | 8.38 | 88-73-3 | 75 | 111、157 | 0.014 | 0.056 |
| p-Dinitrobenzene | 10.78 | 100-25-4 | 168 | 75、50、122 | 0.021 | 0.084 |
| m-Dinitrobenzene | 11.05 | 99-65-0 | 168 | 75、50、92 | 0.012 | 0.048 |
| 2,6-Dinitrotoluene | 11.19 | 606-20-2 | 165 | 63、89 | 0.007 | 0.028 |
| o-Dinitrobenzene | 11.33 | 528-29-0 | 168 | 63、50、76 | 0.015 | 0.060 |
| 2,4-Dinitrotoluene | 12.1 | 121-14-2 | 165 | 63、89 | 0.011 | 0.044 |
| 2,4- Dinitrochlorobenzene | 12.45 | 97-00-7 | 202 | 75、110 | 0.009 | 0.036 |
| 3,4- Dinitrotoluene | 12.79 | 610-39-9 | 182 | 63、89 | 0.011 | 0.044 |
| 2,4,6- Trinitrotoluene | 14.04 | 118-96-7 | 210 | 89、63 | 0.014 | 0.056 |
Conclusion
In this study, an analytical method for 15 nitrobenzene compounds in water was established using the EXPEC 3750 GC–MS system.The method fully complies with the analytical requirements of HJ 716-2014 — Water Quality: Determination of Nitrobenzene Compounds by Gas Chromatography–Mass Spectrometry, achieving accurate qualitative and quantitative determination of nitrobenzene compounds in water.
The analytical performance is summarized as follows:
- The correlation coefficients (R²) of all 15 nitrobenzene compounds were greater than 0.998.
- The method precision (RSD) ranged from 1.40% to 3.52%.
- With a sample volume of 1.0 L, the method detection limits (MDL) ranged from 0.006 μg/L to 0.022 μg/L, and the limits of quantification (LOQ) ranged from 0.024 μg/L to 0.088 μg/L.